JsHint
While reading this set of ECMAScript 5 coding standards is a step in the right direction, it does not get you all of the way. Some rules are easier to remember and stick to than others. It is best to have a tool that programmatically checks your sources code for violations of coding standards as you develop, and highlights them within your IDE, and gives you detailed output as part of your build process.
There are several tools out there that do this, and JsHint is one of the more popular ones. JsHint is most commonly used as a Javascript preprocessor as part of build tools, and most IDEs popular with web developers
.jshintrc
It is definitely worth reviewing the list of configuration options available on JsHint. Looking at which rules are enabled by default (and can be turned off), and which rules are disabled by default (and can be turned on), gives you an good idea of how extremely relaxed the Javascript language specification can be; and thus the importance of using something like JsHint.
These options are configurable using a file named .jshintrc,
which usually sits at the root directory of a project.
A sample .jshintrc file which conforms to the rules
that have been described in the ES5 specifications will be made available soon.
Essentially all the default JsHint options are used, with a few exceptions.
Using WebStorm with JSHint
JSHint is integrated into the WebStorm code quality tooling, it offers realtime feedback and analysis reports. The real time feedback can greatly accelerate a developer’s familiarity in complying with JSHint and preventing errors.
Setting it up in the IDE is done in the menu:
Preferences -> Javascript -> Code Quality Tools -> JSHint
In the JSHint configuration click the Use config files and set the Custom configuration file path
to the provided .jshintrc file above.

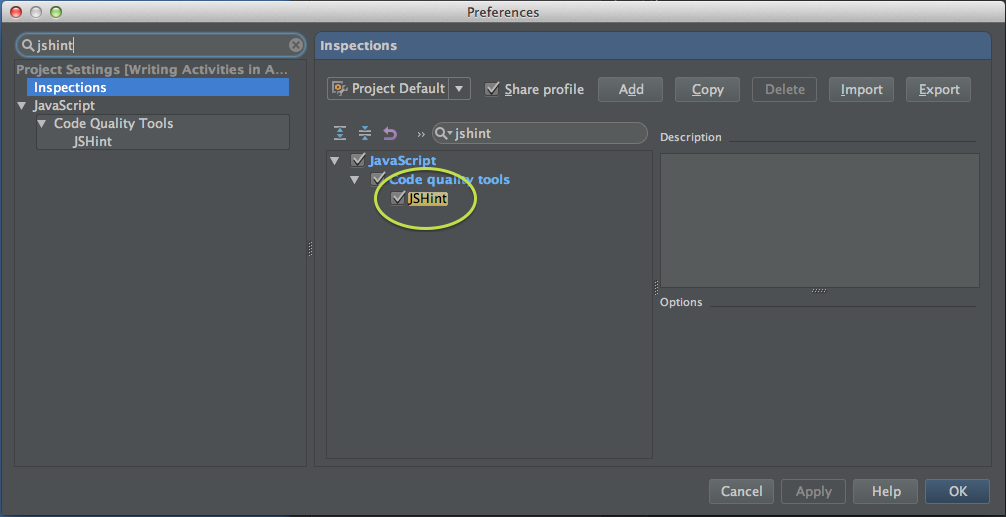
Now you need to verify the JSHint Inspection is also enabled in the Inspections menu, it may previously be enabled on your system.
Preferences -> Inspections -> Javascript -> Code Quality Tools -> JSHint
When your JSHint configuration is working, you will see JSHint output as you code. The jshint issues appear in the line gutter in red and an underline on relevant the code. Hover the gutter to view the error message to see the pop-up like in the example.

WebStorm also integrates JSHint in it’s inspection tools. This is useful for checking and updating multiple files quickly and using the rest of WebStorm’s code quality tools.
In the main WebStorm menu run Inspection.
Code -> Inspect Code...
Choose a scope to inspect in the window that pops up. You can recursively inspect a project of choose a particular file.

After clicking OK the UI will provide populate a list of inspection results.
Clicking the items let you jump to files to resole any issues.
